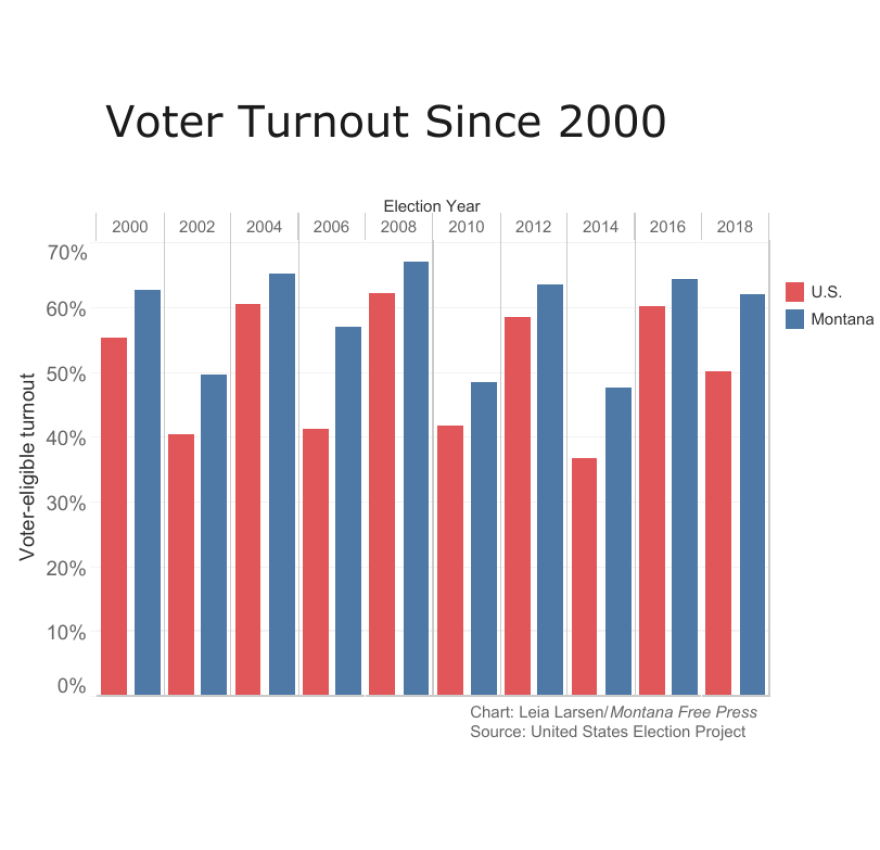
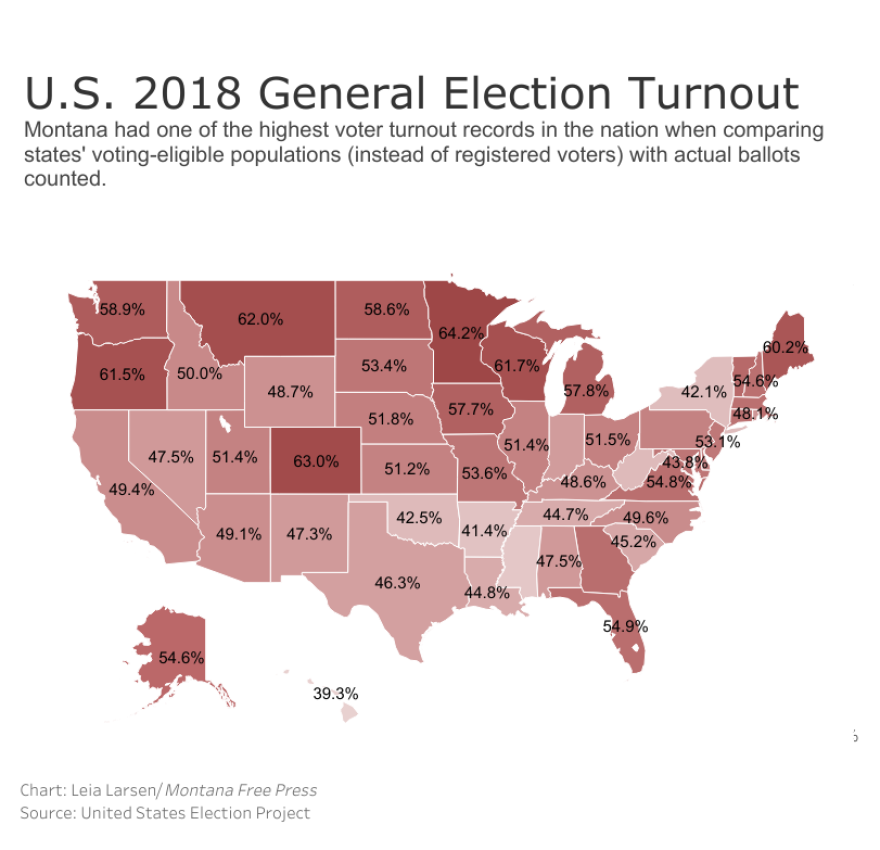
Montana saw high voter participation in the 2018 midterm elections, even for an election noteworthy for remarkable turnout nationwide.
In terms of turnout by registered voters, Montana creamed most Western states, with a turnout rate of 71.5 percent. Only Washington state had higher turnout in the West, counting ballots from 71.8 percent of its registered voters. It’s the highest turnout of registered Montana voters since 1990, according to data compiled on the Montana Secretary of State website.
Election experts point to a few key motivators that drove Montana voters to the polls. Chief among those was a hotly contested senate race between incumbent Jon Tester, a Democrat, and Republican challenger Matt Rosendale that spurred four separate campaign visits from President Donald Trump and additional visits from other high-profile Republicans, including Vice President Mike Pence.
“Tester was widely seen as vulnerable, and for good reason,” said University of Montana political science professor Robert Saldin.
The two-term incumbent senator was a target after winning his past two elections with narrow margins, Saldin said.
Tester also became a Trump target after stirring up concerns about the president’s pick to head the Department of Veterans Affairs, Ronny Jackson.
Last spring, Trump said Tester would have a “big price to pay in Montana” after Jackson withdrew his nomination.
“It was clear from the beginning this was going to be a close election,” Saldin said.
RELATED: Showing purple streak again, voters send Tester, Gianforte back to Washington
Trump’s Montana visits may have galvanized Democrats to show up at the voting booth in opposition, according to Saldin.
“The out [of the White House] party is always mobilized in a midterm,” Saldin said. “This time, with this particular president who was so polarizing and controversial, the out party was even more mobilized.”
The confirmation hearings for Supreme Court Justice Brett Kavanaugh may have helped mobilize Republicans, as well, Saldin said.
“So just at a national level, you have everyone mobilized at a higher level than you typically see during a midterm,” he said.
A close House race between Republican U.S. Rep. Greg Gianforte and Democrat Kathleen Williams upped the ante. Two high-profile ballot measures — one to increase the tobacco tax to help fund Medicaid expansion, and one that would restrict new hard-rock mining permits — may also have driven nonpartisan turnout.
RELATED: Big Tobacco violated campaign laws, commissioner finds
In all, just under $45.4 million was contributed to the state’s candidates and committees in 2018, according to the most recent data from the National Institute on Money in Politics. That’s more campaign funds than flowed through Montana in the 2016 presidential election.

“All of that bundled together, I think, lent this midterm election the feeling and energy that we typically only see in presidential years,” Saldin said.
Michael P. McDonald, a political scientist at the University of Florida, said there’s slightly more to Montana’s high voter-turnout, which mirrored national trends.
McDonald has compiled data on the nation’s voting-eligible population since 2000 for the United States Elections Project. Calculating the voting-eligible population means adjusting the number of voting-age people living in the U.S. by subtracting ineligible felons and non-citizens.
Most states, including Montana, base turnout calculations on registered voters. But the voting-eligible calculation provides a clearer picture of turnout trends across states, McDonald said.
“States vary in how they manage voter registration,” he said. “In some states, people persist on [registration] rolls longer than in other states. Other states are more aggressive about purging ineligible voters.”
Accounting for voting-eligible populations, Montana had a 2018 turnout rate of 62 percent — the third-highest turnout rate in the nation. The U.S. average was 50.1 percent.

Treasure State voters showed up in higher percentages even compared to states such as Arizona and Texas, which also saw high-profile, competitive U.S. Senate races and big money.
McDonald said that turnout difference lies in demographics. Arizona and Texas have bigger Latino populations than Montana.
“We know that Latinx [and] Hispanics tend to vote at much lower rates than other groups in the population,” he said.
Montana’s population is whiter and tends to be better-educated than some states farther south, which often correlates to higher voter turnout. It’s a trend McDonald sees in many northern states.
“If you look across the upper tier of the U.S., they all have higher turnout rates. It’s not just Montana,” he said.
Another big factor in turnout, McDonald said, is voter registration policy. Montana is one of 15 states plus the District of Columbia that allow voters to register until the close of polls on Election Day.
“Registration deadlines are one of the larger impediments to higher turnout,” McDonald said.

Numerous studies, compiled by the National Conference of State Legislatures, have found voter participation is 4 to 7 percent higher in states that allow same-day registration.
While Montana’s 2018 midterm turnout was higher than other midterm years since 1990, bigger turnout was a trend seen nationwide this election.
The 50.1 percent national turnout hasn’t been seen in a midterm since 1914, when 50.4 percent of eligible U.S. voters cast ballots.
“There’s only one explanation I can think of, and it’s Donald Trump,” McDonald said. “He’s impassioned people in the country.”
Given that Trump wasn’t even on the ballot in 2018, McDonald said, 2020 will likely be an interesting year.

• CORRECTION: This story was updated to correct registered voter turnout in Utah.
This story comes courtesy of Montana Free Press
BY-NC-ND 3.0 US Creative Commons license
About Leia Larsen
Leia is an award-winning reporter who has covered the environment and public policy in Colorado, Utah, and now the Montana capital. She has a master's degree in journalism from the University of Colorado Boulder. Contact her at llarsen@mtfp.org or (406) 465-3386.


